
Technical manual - v1.1
Technical manual - v1.1IntroductionNotationsQuantification of liquefaction hazardPhenomenological remindersSoil sensitivity against liquefactionSimplified "NCEER" procedureDomain of validityPrinciples of calculationNormalized equivalent cyclic shear stressNormalized cyclic resistance ratioGeneral assumptions of calculationStress states in the soil Taking into account project seismic magnitudesAdditional corrections correction factor for NCEER-SPT for NCEER-CPT Correction FactorEvaluation of the cyclic resistance ratioAssessment based on standard penetration tests (SPT)Principle of the SPT testInput parameters - SPTFormulation of based on the SPT testsStep n°1: Normalizing the number of blowsStep n°2: Correction for fines content to get a "clean-sand" equivalentStep n°3: Expression of cyclic resistance ratioAssessment based on cone penetration tests (CPT et CPTu)Principle of the CPT(u) testInput parameters - CPT(u)Formulation of based on CPT(u) testsStep n°1: Normalization of Cone Penetration parameters CPT(u)Step n°2: Correction for fines content to get a "clean sand" equivalentStep n°3: Expression of cyclic resistance ratio Additional notes on the soil behaviour type index Evaluation of earthquake-induced settlementsPrinciples of calculationEstimation of volumetric strains Zhang, Robertson and Brachman (2002) Correlations From CPT(u) testsFrom SPT testsIdriss and Boulanger (2008) Correlations From CPT(u) testsFrom SPT testsAdditional indicatorsCumulative liquefiable thicknessesLiquefaction Potential Index LPIReferences
Introduction
Slake is intended for the complete carry out of quantification analyses of liquefaction hazard of soils subjected to seismic loading in open field by the direct semi-empirical method known as "NCEER" (Youd and Idriss, 2001)(1), using SPT (standard penetration test) and/or CPT(u) (cone penetration test with or without pore-water pressure measurement) data. By simplification, these analyses are called NCEER-SPT and NCEER-CPT in the following.
(1) Slake v1.1 also features an additional calculation option derived from the simplified "NCEER" procedure, taking into account certain adaptations resulting from the recommendations of the AFPS Technical Notebook n°45 "Assessment of the risk of soil liquefaction under the effect of earthquakes - Practical knowledge and applications to geotechnical projects" (NCEER/CT45-AFPS(2020) calculation option).
The determination of factors of safety against liquefaction is coupled with a strain analysis, allowing the estimation of post-liquefaction settlements under a water table according to the correlations proposed by different authors and derived from the charts of Ishihara and Yoshimine (1992).
Notations
Thereafter, the following notations are adopted:
| Parameter or acronym | Unit | Description |
|---|---|---|
| - | Geometric factor for taking pore-water pressure into account in tests with piezocone | |
| Peak Ground Acceleration, noted also as PGA | ||
| Clay content ; defined as the percentage by weight passing through a 2 µm sieve (according to NF P 11-300) | ||
| Silt content ; defined as the percentage by weight passing through a 63 µm sieve (according to NF P 11-300) | ||
| - | Cone Penetration Test | |
| - | Cone Penetration Test with pore-water pressure measurement thanks to electrical point (piezocone) | |
| Relative density of a granular material | ||
| Fines content defined as the percentage of passing by weight through the 75 µm sieve according to USCS classification (the most similar sieve in France is 80 µm) | ||
| - | Factor of safety against liquefaction | |
| Acceleration of gravity | ||
| Unit weight of the fill materials if any | ||
| Saturated unit weight of the material | ||
| Unsaturated unit weight of the material | ||
| - | Soil Behaviour Type Index (Robertson) | |
| - | Threshold above which soils tested by cone penetration test CPT(u) and qualified by the soil behaviour type index are deemed too fine or too plastic to liquefy | |
| Plasticity index ; determined from consistency indices : | ||
| - | Moment magnitude of earthquake | |
| - | Surface-wave magnitude of earthquake | |
| - | Magnitude Scaling Factor, correction factor on the project earthquake magnitude compared to magnitude 7.5 | |
| - | Correction factor (magnitude scaling factor) on the project earthquake magnitude determined from the lower bound of the range proposed by the "NCEER" procedure | |
| - | Correction factor (magnitude scaling factor) on the project earthquake magnitude determined from the upper bound of the range proposed by the "NCEER" procedure | |
| - | Correction factor (magnitude scaling factor) on the project earthquake magnitude corresponding to the average between the upper and lower bounds of the range proposed by the "NCEER" procedure | |
| Reference pressure taken equal to atmospheric pressure, approximately 100 kPa | ||
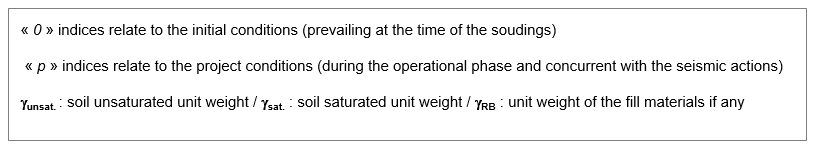
| - | Reference coordinate system (for example: NGF, NVP, ...); allowing to link the investigation depths (relative) to elevations (absolute) | |
| Total vertical stress in project conditions | ||
| Effective vertical stress in project conditions | ||
| Total vertical stress in initial conditions at the time of the tests | ||
| Effective vertical stress in initial conditions at the time of the tests | ||
| - | Standard Penetration Test | |
| Pore-water pressure measured by the pressure sensor u2 (on the sleeve at the back of the cone) in the case of test with piezocone | ||
| Elevation of the water-table in initial conditions at the time of testing expressed in the chosen coordinate referencing system | ||
| Elevation of the water-table in the conditions of project (concomitant with the earthquake) expressed in the chosen coordinate referencing system | ||
| Initial elevation of natural ground (initial conditions) | ||
| Final elevation of the ground (project condition) |
Quantification of liquefaction hazard
Phenomenological reminders
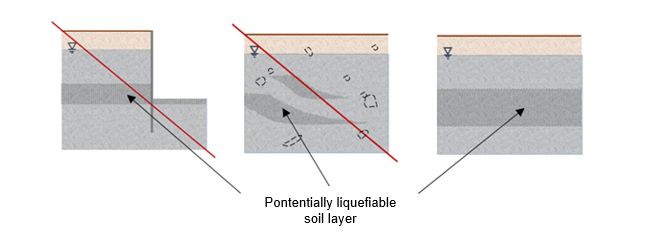
Liquefaction is a characteristic instability of contracting saturated sands (granular materials in a very loose to loose state) that can develop increased pore-water pressures as a result of cyclic stress in undrained conditions. These large pore-water pressures are responsible for the loss of resistance by reducing - or even canceling - the effective stress in the soil. Under certain conditions, this phenomenon can also take place under a monotonous loading, which is called static liquefaction.
The phenomenon of liquefaction is to be distinguished from the cyclic mobility, also characterized by a behaviour at constant or nearly constant volume (saturated materials in undrained conditions) and which affects the dilative sands (granular materials in a moderately dense to very dense state). For the latter, the generation of excess pore-water pressures during loading leads to temporary losses of resistance and significant cyclic deformation, but the tendency to dilatancy that occurs during shear prevents overall loss of resistance and significant permanent deformation.
Soft clays are prone to another phenomenon, cyclic softening, which causes a loss of stiffness due to the potentially large accumulation of irreversible deformations under cyclic loading.
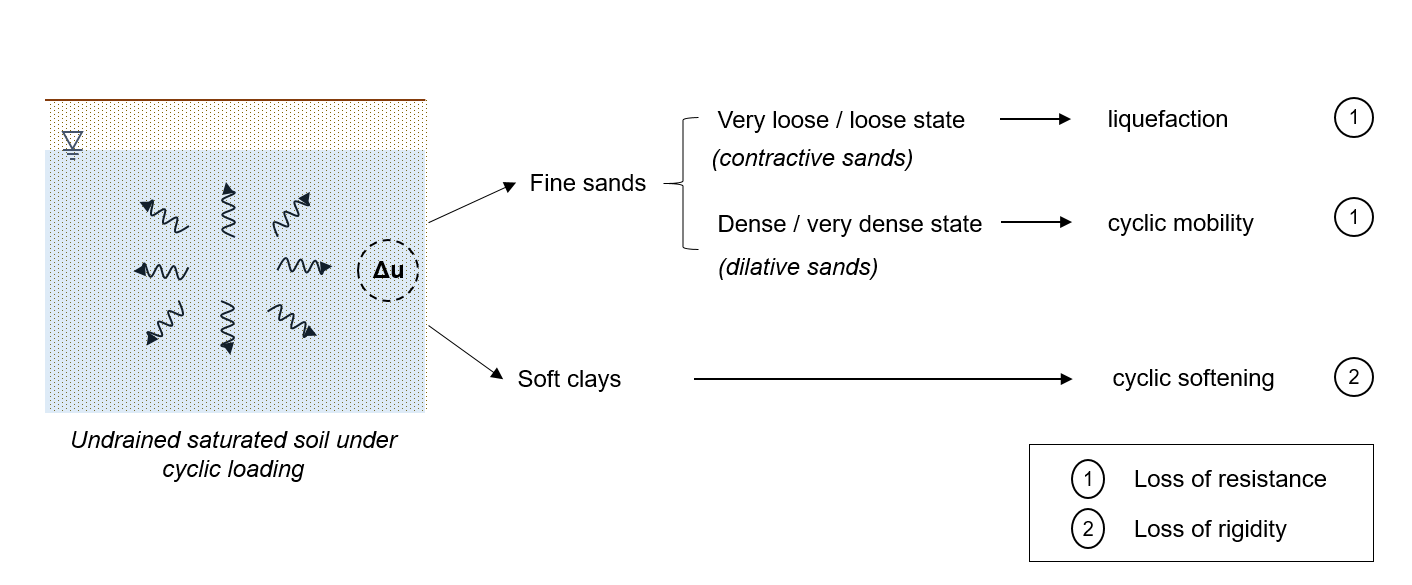
The simplified semi-empirical calculation method implemented in Slake allows the quantification of hazard only within the strict framework of the liquefaction phenomenon as defined above, apart from the instabilities associated with cyclic mobility and cyclic softening.
Soil sensitivity against liquefaction
Soil physical properties were the first characteristics used to estimate their susceptibility against liquefaction. Different criteria for sensitivity analysis have been proposed, historically based on the limits of consistency, granulometric properties and water content, or combinations of these properties.
Slake featers a Liquefaction Sensitivity Assessment Wizard that complies with the current requirements of Eurocode 8 Part 5 (EC8-5). This wizard is independent from the quantitative hazard analysis, which can be examined locally using SPT and/or CPT(u) surveys using different methods. At a specific measurement point, and based on the analysis of the Eurocode criteria detailed below, the Wizard determines "the need for a quantitative hazard analysis", or on the contrary "the possibility of ruling out the risk of liquefaction".
This assessment is based on the examination of one main condition concerning the seismic assumptions of the project, plus three additional criteria derived from laboratory and in situ test results: granulometry, plasticity, normalized SPT test results. The verification of the main condition and, simultaneously, of at least one of the three additional criteria, allows the risk of liquefaction in the sense of EC8-5 to be neglected. If not, the risk of liquefaction must be quantified.
| **Main condition: the coefficient of horizontal acceleration at the surface () is strictly less than 0,15 | |
|---|---|
| Additional criterion [1]: sands contain clay in a proportion strictly superior to 20%, with a plasticity index strictly superior to 10% | and |
| Additional criterion [2]: the sands contain silts in a proportion strictly higher than 35% and, at the same time, the SPT blow count normalized for the effect of overburden and the energy ratio is strictly higher than 20 | and |
| Additional criterion [3]: the sands are clean, with the value of the number of SPT blows, normalized for the effect of overburden and the energy ratio is strictly higher than 30 | and |
Note: it shall be reminded that there is no consensus on the use of sensitivity criteria, particularly with regard to risk exclusion criteria. Nevertheless, the criteria offer a practical entry point (at least qualitatively) for assessing the sensitivity of soil against liquefaction.
Simplified "NCEER" procedure
Slake is based on the implementation of the simplified analysis procedure formalized by Youd and Idriss in 2001 following the consensus reached at the working seminars on soil resistance to liquefaction organized by the NCEER research in 1996 and jointly NCEER/NSF in 1998 (published in the ASCE journal JGGE in April 2001). By simplification, this methodology is noted as the "NCEER" procedure in the following.
As of 2021, the "NCEER" procedure is still considered to be the international reference for quantifying liquefaction hazard of soils (sole consensus). The methods proposed by Idriss and Boulanger in particular are variations of the latter, but do not reach consensus.
Note: in its current version (v1.1), Slake features an additional calculation option : NCEER/CT45-AFPS(2020).
This alternative calculation option takes up the general principles of the "NCEER" procedure (detailed in the following paragraphs) with subtle adaptations/modifications to certain clearly identified calculation parameters, in accordance with the recommendations made in the appendices of Technical Notebook n°45 "Assessment of the risk of soil liquefaction under the effect of earthquakes - Practical knowledge and applications to geotechnical projects" (to be published in 2021) by the "Liquefaction" Sub-Working Group of the AFPS (french association for earthquake engineering).
When applicable, these modifications are detailed in the relevant paragraphs. Wherever this is not expressly stated, the "NCEER/CT45-AFPS(2020)" calculation option strictly follows the calculation assumptions of the "NCEER" procedure.
Domain of validity
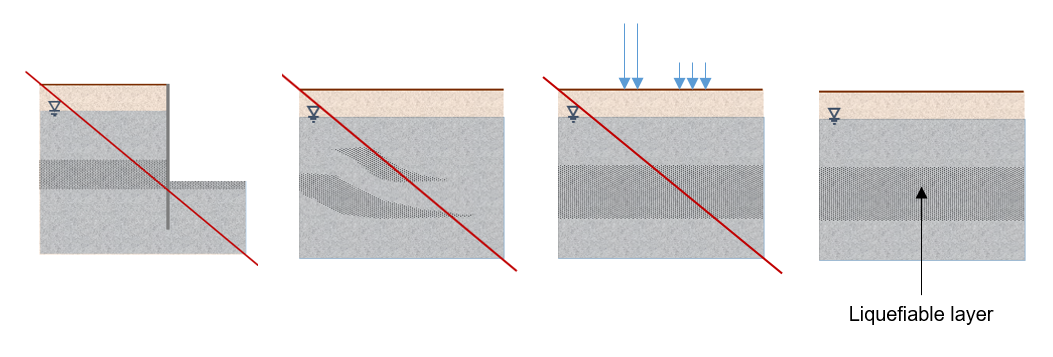
The "NCEER" procedure is a deterministic approach, in total stress, and considering the hypothesis of open field site conditions, i.e. assuming the spatially unconstrained liquefiable layers(s) and susceptible(s) to be freely set in motion (one-dimensional calculation).
It was developed empirically from the compilation of field data (in situ tests of different types) and laboratory tests performed on samples composed of siliceous alluvial materials (silty sands), of Holocene age, collected at shallow depths and from sites mainly in California, under level to gently sloping ground having liquefied or not liquefied as a result of earthquakes of magnitude equal to 7.5.
The results of any analysis conducted outside the strict assumptions of the "NCEER" method's validity domain must be subject to critical analysis by the geotechnical engineer.
These considerations are also valid when the calculation option "NCEER/CT45-AFPS(2020)" is selected.
Principles of calculation
For an earthquake of any magnitude, the method consists in the assess of a factor of safety against liquefaction defined as the ratio between the normalized cyclic resistance ratio (Cyclic Resistance Ratio) of the ground for a reference earthquake of magnitude of 7.5 on the one hand, and the equivalent normalized shear stress generated by the earthquake (Cyclic Stress Ratio) on the other hand, at any point where measurements are available in the tested soil column.
This ratio is then corrected by the term (Magnitude Scaling Factor) which allows to take into account the project magnitude of the earthquake under consideration, and by the possibly combined effects of confining pressure () and inclination of stress ().
The factor of safety against liquefaction is then expressed as follows:
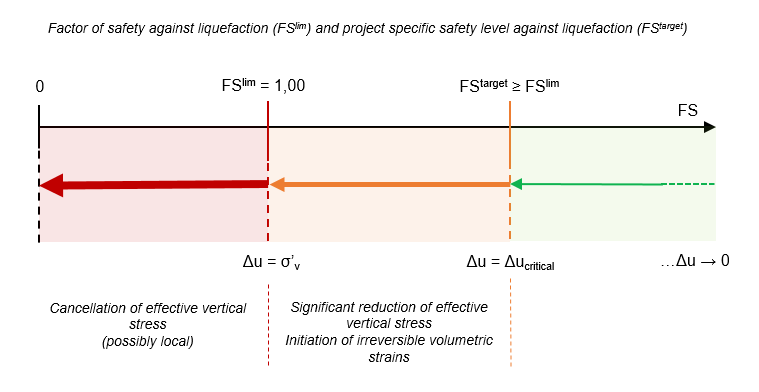
Theoretically, liquefaction occurs when the factor of safety is less than the unit (local cancellation of the vertical effective stress). The accumulation of irreversible volumetric strains associated with a significant reduction in vertical effective stress may nevertheless develop due to excess pore-water pressures for computation points with factors of safety greater than the unit.
In Slake, the threshold of the stability domain is thus limited by the limit factor of safety , while the lower limit of the safety domain is bounded by the targeted factor of safety noted directly inputed by the user with respect to a pre-defined level of safety.
As an indication, Eurocode 8 currently sets the minimum safety threshold at 1.25, a value associated with the development of excess pore-water pressures in the order of 60% of the vertical effective stress. This threshold can be increased according to the nature and sensitivity of the studied structure, being implicitly understood that beyond this value the earthquake-induced post-liquefaction deformations are negligible and therefore acceptable by the supported structure.
- : liquefaction (total cancellation of vertical effective stress, local loss of total resistance) ;
- : accumulation of significant irreversible deformations (loss of strength) against a predefined level of safety.
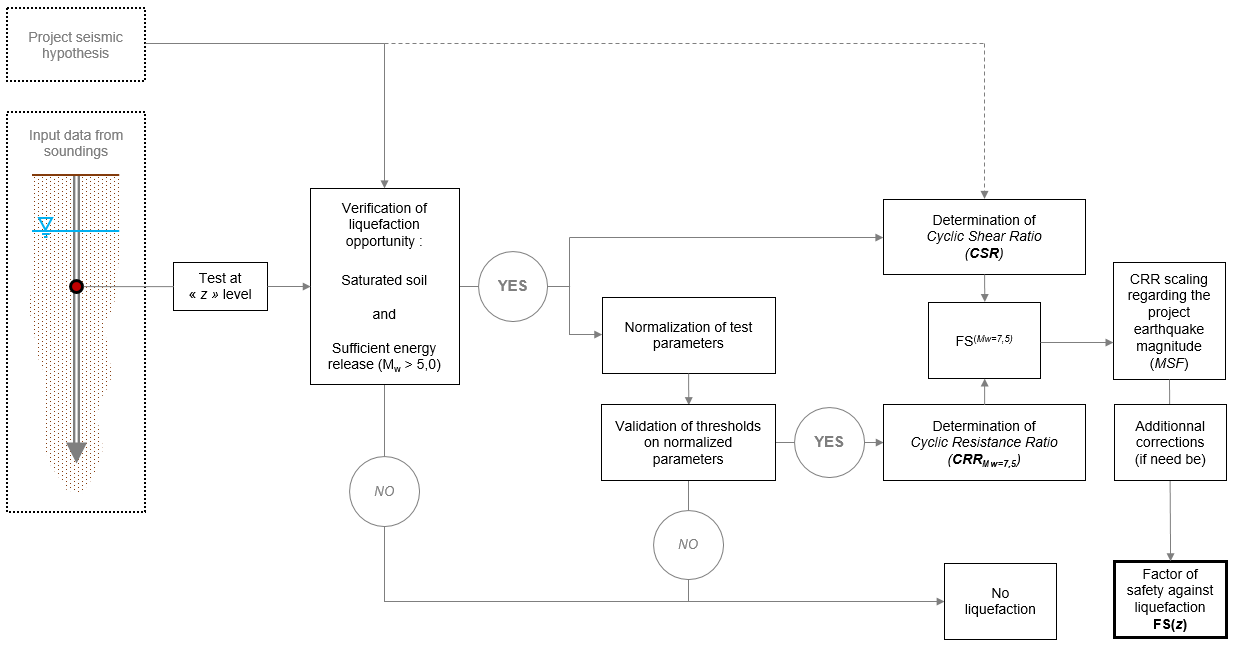
Slake presents the FS calculation results only at points where the following double condition is verified:
The calculation point (ie the test point) is below the project water-table level: ;
The normalized measurement at the point of the test (depending on the type of test) does not exceed the threshold values beyond which it is conventionally accepted that the materials tested are too dense to be liquefiable:
- Case of SPT surveys: ;
- Case of CPT(u) surveys: .
In the case of CTP(u) analyses, an additional criterion applies on the basis of the behaviour type index . Soils with a behaviour type index greater than or equal to a threshold value are considered too fine and/or plastic to liquefy:
Usually, is set at 2.6. However, it is possible to change the threshold value on the behaviour type index in Slake. The threshold should then be calibrated from cyclic laboratory tests. Changing this threshold value is strongly discouraged.
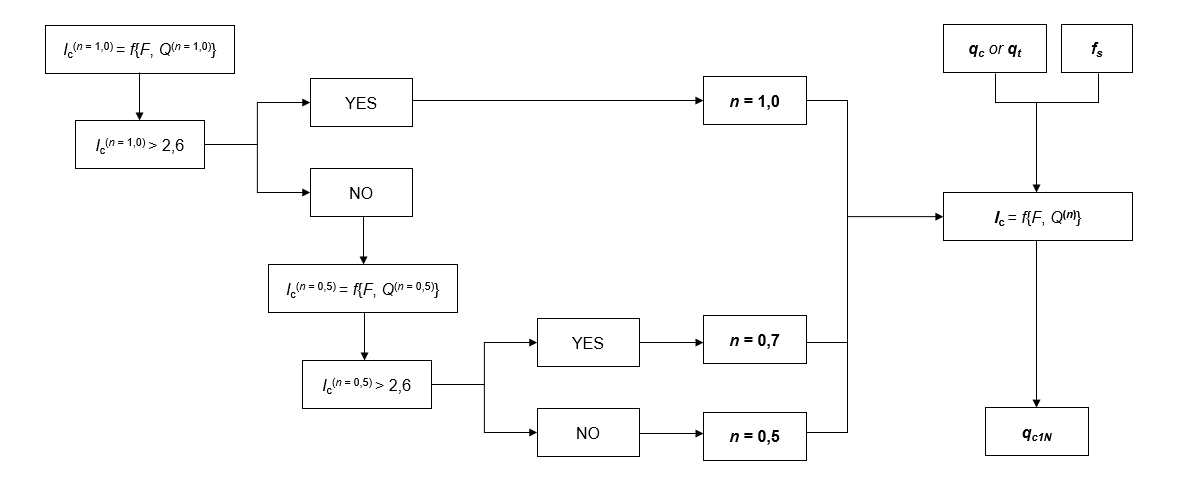
The process for safety factor determination against liquefaction is synthesized in the following logigram.
Normalized equivalent cyclic shear stress
The cyclic shear stress induced by the earthquake normalized by the vertical effective stress is assessed from the following equation (Seed & Idriss, 1971):
The coefficient is a coefficient of stress reduction based on the depth resulting from soil flexibility; it is defined in Slake according to Blake's formula (1996):
Where z is the depth. This formulation of the term is strictly valid only up to 15 m deep, and is no longer applicable beyond 20 m. It is implicitly accepted in Slake that the user provides in situ test results to depths deemed compatible with the development and surface expansion of liquefaction effects. Attention is drawn to the fact that the factor is therefore not limited and is extrapolated to any depth following this formulation by the software.
Normalized cyclic resistance ratio
The term (Cyclic Resistance Ratio), thus the normalized cyclic resistance ratio offered by the examined soils, is estimated by post-processing of the results of in situ SPT and/or CPT(u) tests. The definition of the term is detailed in the paragraphs relating to the computation of each test category.
General assumptions of calculation
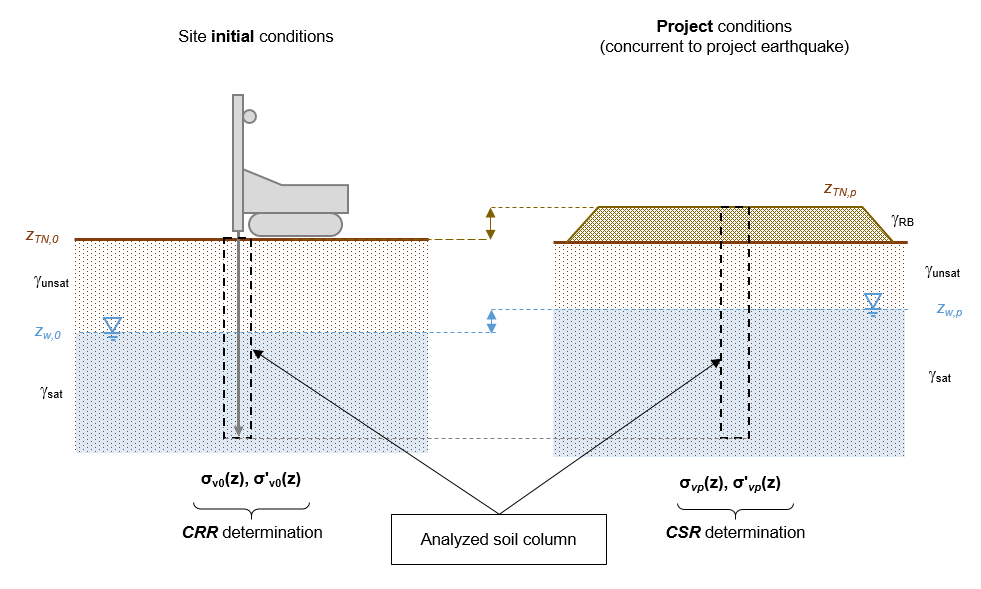
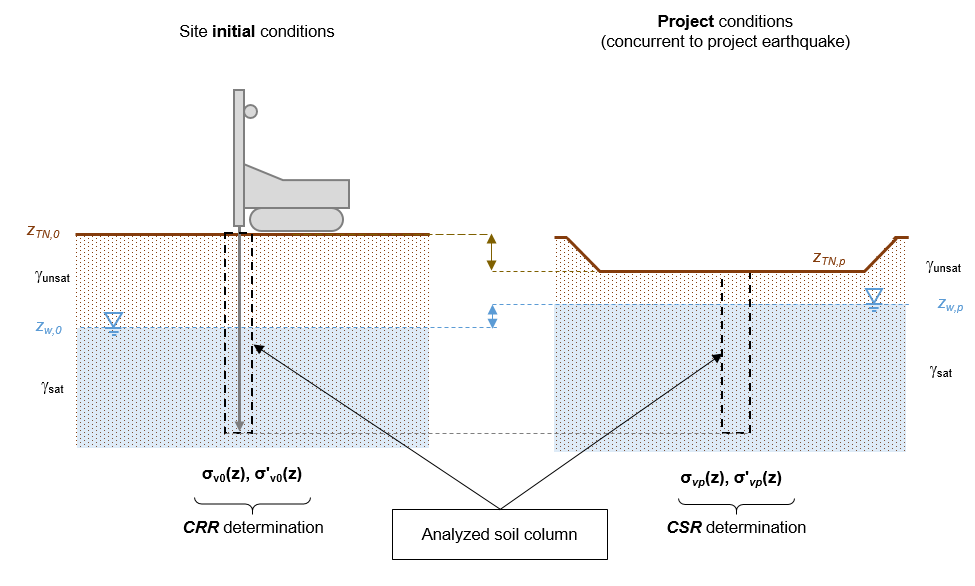
Stress states in the soil
Liquefaction analyses are conducted by defining two distinct multilayer geotechnical models to distinguish the calculation of stress states relating to the cyclic resistance term (CRR) and the term of earthquake action (CSR). The first one is representative of the context prevailing at the time of the surveys, while the second one must be representative of the conditions projected in the operational phase and concurrent with the considered seismic actions.
These models take into account:
- The possible change in the topographical conditions of the site after the completion of the surveys: filling or excavation on a large area of the site in the operational phase compared to the intial conditions. It should be noted that these variations in the overall appearance of the site are to be distinguish from the localized overloads (point loads) brought by the structures and which should not be taken into account in the case of open field analyses;
- Variations in water-table levels between piezometric measurements in initial conditions at the time of in situ testing and project water-table levels concomitant with seismic actions.
Taking into account project seismic magnitudes
The "NCEER" procedure recommends a range for estimating the correcting factor based on seismic magnitudes . The latter are to be distinguished from the magnitudes of surface waves (). As an indication, it is shown below the transformation of a magnitude measure to another that can be made according to the bilinear relations of Scordilis (2006), valid for shallow earthquakes (less than 70 km).
It is commonly accepted that below a magnitude of 5.0 the energy released by seismic waves is not sufficient to initiate the phenomenon of liquefaction (lack of counter-examples referenced as of 2019). It should be noted that Slake determines MSF values by extrapolation beyond the limits defined by the "NCEER" procedure ( and ).
The MSF range recommended by the "NCEER" procedure as well as the equations of the lower () and upper () bounds are shown below.
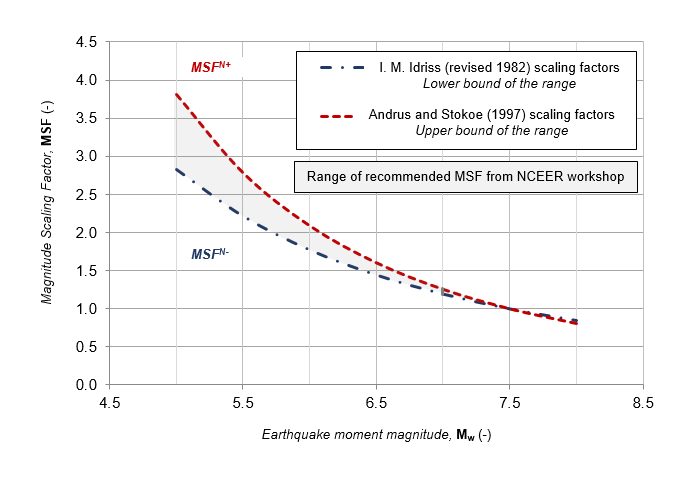
| Lower bound of "NCEER" range | Upper bound of "NCEER" range |
|---|---|
| (Idriss corrected 1982) | (Andrus and Stokoe 1997) |
Note 1: Slake provides an intermediate option for the determination of the magnitude scaling factor directly corresponding to the arithmetic mean, for a given magnitude of seismic moment, between the values associated with the lower and upper bounds of the recommended range : .
Note 2: it is possible to manually insert into Slake any value of . However, it is recalled here that the and parameters are strictly linked; it is therefore not recommended to input correction factors outside of the proposed range as part of analyses conducted strictly according to the "NCEER" procedure (nor the “NCEER/CT45-AFPS(2020)” option).
Additional corrections
The equation (1) involves two complementary correction factors and which are outside the framework of the simplified "NCEER" procedure.
correction factor
Laboratory cyclic loading tests indicate that liquefaction resistance increases with increasing confining stress, but not linearly (the normalized resistance CRR decreases as the effective confining stress increases). In order to extrapolate the normalized resistance CRR (obtained by simplified method for a vertical stress of 100 kPa) to layers where the effective stress are greater than 100 kPa taking into account this non-linearity, Seed (1983) introduced a corrective factor. The values were obtained from cyclic triaxial tests on clean-sands with various relative densities and consolidated under stress between 100 kPa and 600 kPa.
The use of this correction factor may be justified in potentially liquefiable sandy soils located at a deep depth, or in the case of a deep water-table.
In the 2001 paper, the formulation of Hynes and Olsen (1999) defines the parameter as the vertical effective stress normalized by atmospheric pressure (approximately 100 kPa) and then raised to the power depending on site conditions: relative density, age of deposits, level of overconsolidation.
In practice, the definition of the exponent is reduced to a correlation based on relative density . The values chosen for are summarized in the table below.
| Condition on the relative density of granular materials | Exponent |
|---|---|
| 0,8 | |
| linear variation between 0.8 and 0.7 | |
| linear variation between 0.7 and 0.6 | |
| 0,6 |
Precaution: The relative density is a notion only relevant to granular materials, with a fine content 1 strictly less than 15%. To correct this problematic definition, because it is not independent of the nature of the soils, Slake does not take into account by default the correcting factor (). However, the user can force the calculation of this correction term, if he wishes, by activating the option in the advanced calculation parameters. If so, the calculation is systematically limited to a unit value:
1 Strictly speaking, the fine content () used to establish these correlations must be consistent with the USCS, and therefore corresponds to the percentage of passing by weight through the 75 µm sieve. This sieve is not used in the French standards of sieve analyses (in the old NF P 94-056 standard, the fine content is defined by the percentage of passing by weight through a sieve of 80 µm; in the new NF P 94-512-4 standard it is defined by the passing through a 63 µm sieve). It is therefore important that the definition of chosen is compatible with the strict application of the NCEER-SPT procedure, i.e. a passing through a 75 µm sieve, or, failing that, 80 µm sieve.
for NCEER-SPT
In the case of an NCEER-SPT analysis, the user can choose to impose the correction factor calculation by activating the dedicated switch in the advanced calculation settings. If so, the following should be provided:
- The threshold value of the fine content below which a relative density value can be estimated (by default, );
- The layer or layers for which the calculation of is imposed by the user.
At calculation points included in the interval (or intervals) defined by the selected stratigraphic layer(s) where the condition on the fine content is verified (), the relative density is estimated thanks to the Skempton (1986) correlation:
At calculation points where , no relative density is calculated and the factor is automatically taken equal to .
The correction factor is then calculated from the equation (4).
Important note: Skempton's correlation was established for medium to coarse, clean quartz sands of relative densities between 0.35 and 0.85, under stress between 50 kPa and 250 kPa. Outside the validity domain of this correlation, and in general, the user is asked to control the calculation results. In the result tables, Slake highlights the calculation results where the relative density estimated by correlation is outside the range .
Case of the "NCEER/CT45-AFPS(2020)" calculation option
When selected, the definition of correction factor for SPT based analysis remains an "advanced" calculation option to be set manually. However, the calculation conditions differ on the following points:
The default value of the fines content threshold below which the calculation is performed is arbitrarily raised to 100% (although it can be modified by the user), with the effect of "forcing" (a priori) the calculation at any measurement point of a layer where the option has been selected;
The upper bound of , equation (5)) is no longer locked to the unit but is to be filled in by the user; by default its value is taken to be equal to ;
The value of the exponent f is no longer directly calculated by correlation with the relative density , and is considered constant even in the case of a multilayer. It must be filled in by the user. By default, the exponent is taken equal to 0.7 (conservative approach);
At the calculation points contained in the interval(s) defined by the selected stratigraphic layer(s) where the condition on the fine fraction is verified , equation (4) is replaced by the following expression :
This approach aims at simplifying the calculation of the correction factor without setting conditions on the relative density of the soils on a flat-rate basis.
for NCEER-CPT
In the case of an NCEER-CPT analysis, the user can choose to impose the correction factor calculation by activating the dedicated switch in the advanced calculation settings. If so, the following should be provided:
- The threshold value of the soil behaviour type index below which the tested soil is deemed to be granular and therefore a value of relative density can be estimated (by default, ) ;
- The layer(s) for which the calculation of is imposed by the user.
At calculation points included in the interval (or intervals) defined by the selected stratigraphic layer(s) where the condition on the soil behaviour type index is verified (), the relative density is estimated thanks to the Baldi (1986) correlation:
At the calculation points where no relative density is calculated and the factor is automatically taken equal to .
The correction factor is then calculated from the equation (4).
Important note: Baldi's correlation is strictly applicable only in the case of fine to medium clean siliceous sands, homogeneous and uncemented, normally consolidated and moderately compressible. Moreover this relationship is not valid at shallow depth of penetration: the calculation of in Slake is therefore fixed to carry out only beyond 3.0 m deep. Outside the validity domain of this correlation, and in general, the user is asked to control the calculation results. In the result tables, Slake highlights the calculation results where the relative density estimated by correlation is outside the range.
Case of the "NCEER/CT45-AFPS(2020)" calculation option
When selected, the definition of correction factor for CPT(u) based analysis remains an "advanced" calculation option to be set manually. However, the calculation conditions differ on the following points:
- The default value of the fines content threshold below which the calculation is performed is arbitrarily raised to 2.6 (although it can be modified by the user), with the effect of "forcing" (a priori) the calculation at any measurement point of a layer where the option has been selected;
- The upper bound of , equation (5)) is no longer locked to the unit but is to be filled in by the user; by default its value is taken to be equal to ;
- The value of the exponent f is no longer directly calculated by correlation with the relative density , and is considered constant even in the case of a multilayer. It must be filled in by the user. By default, the exponent is taken equal to 0.7 (conservative approach);
- At the calculation points contained in the interval(s) defined by the selected stratigraphic layer(s) where the condition on the fine fraction is verified , equation (4) is replaced by equation (7).
This approach aims at simplifying the calculation of the correction factor without setting conditions on the relative density of the soils on a flat-rate basis.
Correction Factor
Theoretically, the development of static shear stress in a sloping soil mass influences its ability to withstand liquefaction. This influence - positive or negative - depends in particular on the nature, density and confining state of soil. Some authors propose to express it using a specific correction factor,, without the latter being the subject of a consensus as of the date (2019).
Slake does not allow the correction factor to be taken into account in the execution of routine liquefaction analyses ().
Evaluation of the cyclic resistance ratio
Assessment based on standard penetration tests (SPT)
Principle of the SPT test
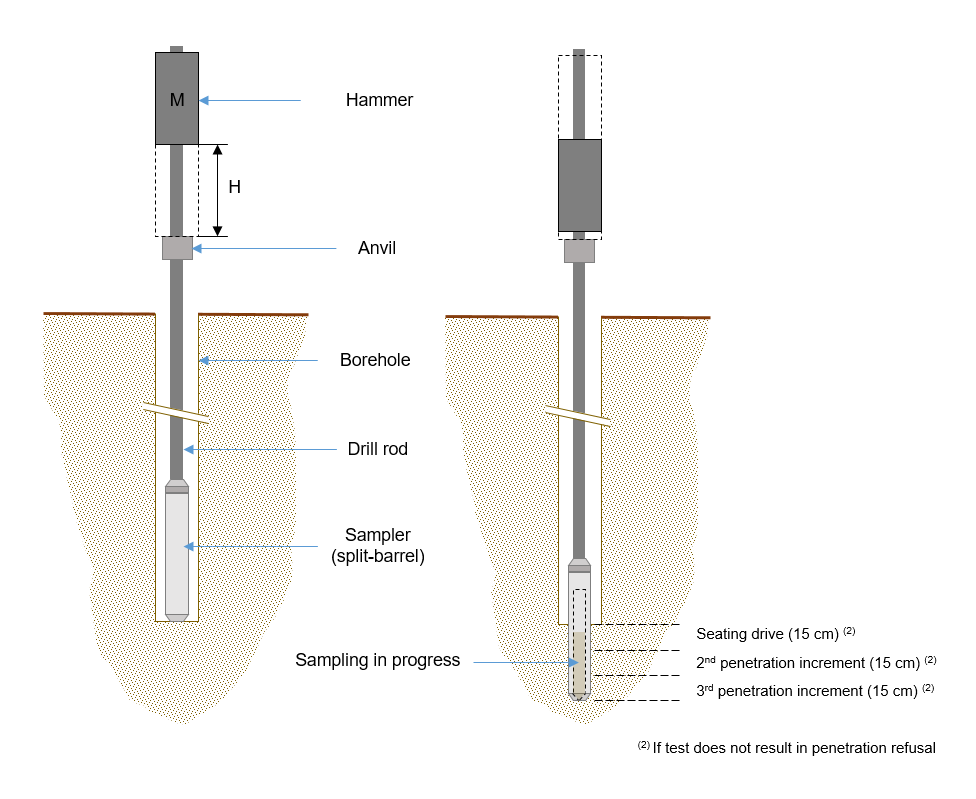
The Standard Penetration Test (SPT) is a standardized dynamic in situ test that also allows the collect of disturbed samples. It is framed by the American standard ASTM-D-1586-11, and partially included in the French application standard NF EN ISO 22476-3.
In a pre-drilled borehole, the test involves pushing a casing following a standardized driving device and counting in successive stages the number of blows needed for a specific penetration of the casing into the ground. Conventionally, and in the absence of refusal, the "SPT resistance" corresponds to the number of blows needed to penetrate 15 cm of the second () and third () driving increments after a first priming penetration () of 15 cm:
Ideally, the energy actually delivered to the rod string by the driving device is measured with an analyzer, via an instrumented rod.
As part of the liquefaction analyses, the disturbed sample taken from each test is subject to sieve analysis by sieving (NF P 94-056), or at least the measurement of the 80 µm sieve passing.
Input parameters - SPT
Conducting liquefaction analyses from the computation of SPT tests requires the following parameters.
| Parameter | Definition | Information |
|---|---|---|
| Natural ground elevation survey elevation | General | |
| Average piezometric level at the time of testing (preferably measured in a piezometric survey in the immediate vicinity of the SPT survey) | General | |
| Test depth | At any point of measurement | |
| SPT blow count: | At any point of measurement | |
| Fine content of the tested material: percentage (by weight) of passing through 80 µm sieve1 | At any point of measurement | |
| Driving energy ratio | At any point of measurement | |
| Borehole diameter | General | |
| Driving device (to provide in case of no direct measurement of driving energy ) | General | |
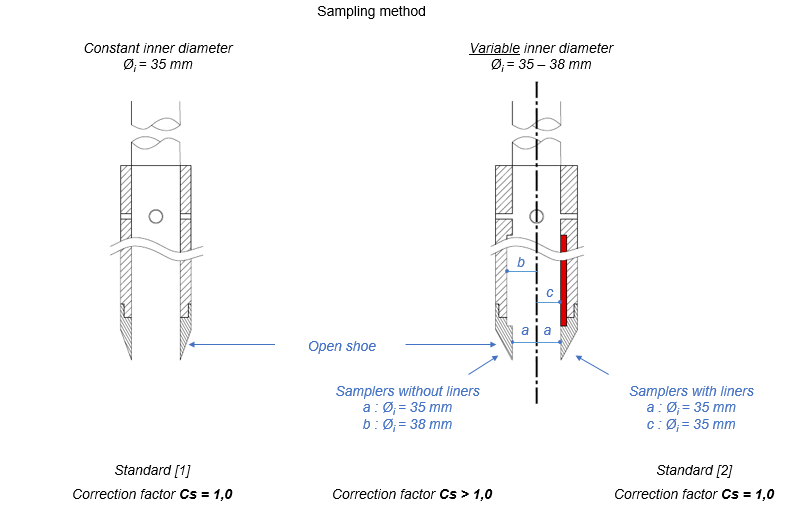
| Sampling method 2 | General |
1 Strictly speaking, the fine content (FC) given for the implementation of the "NCEER" method complies with the requirements of the ASTM, and therefore corresponds to the percentage by weight of passing through the 75 µm sieve. This sieve is not used in the French standard of granulometric analyses (NF P 94-056), the closest is the 80 µm sieve.
2 The sampling method depends on the type of core used: truncated cone cores (variable inner diameter 35 to 38 mm), cylindrical cores (constant inner diameter of 35 or 38 mm) that may or may not be equipped with sampling liners
Formulation of based on the SPT tests
The cyclic resistance ratio term is calculated sequentially. The procedure is schematized in the logigram below.
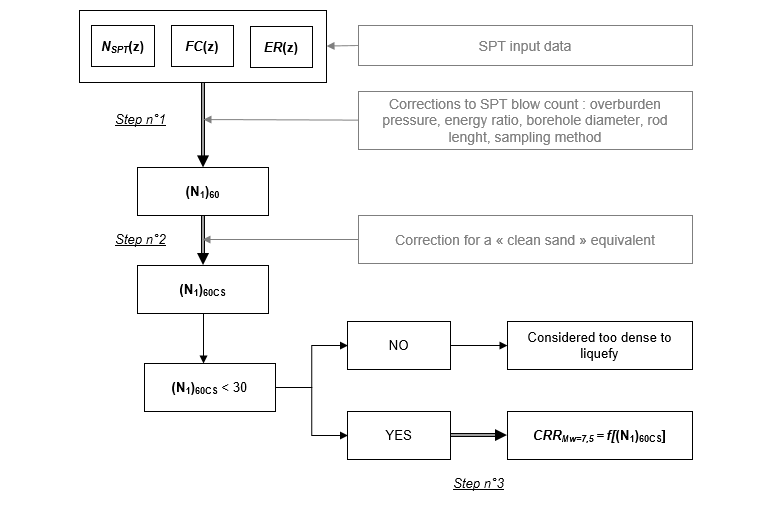
Step n°1: Normalizing the number of blows
The evaluation criterion of cyclic resistance ratio through analysis based on the computation of SPT results rests on a normalization of the number of blows:
The nature and detail of the corrections made are described in the following table.
| Correction factor | Parameter | Type0 | Expression of the correction |
|---|---|---|---|
| Overburden pressure1 | Automatic | ( Liao et Whitman, 1986) | |
| Energy ratio2 | Automatic/Manual2 | ||
| Borehole diameter | Manual | ||
| Rod string length3 | Automatic | ||
| Sampling method4 | Manual |
0 For the definition of the "type" of correction, "Automatic" means that it is directly applied by the software, "Manual" means that the correction depends on specific input parameters to be provided by the user.
1 The normalization of the number of SPT blows relative to the stress level is calculated using the formulation of Liao and Whitman (1986). This correction term is automatically limited to . This correction applies to the states of stress prevailing in the studied soil at the time of the execution of the tests; they are normalized by a reference pressure taken equal to the atmospheric pressure (~100 kPa).
2 The driving impact energy is expressed in terms of the energy ratio between the energy actually transmitted to the string of rods (measured with an analyzer, ) and the theoretical maximum potential energy (), i.e. . This ratio should, of course, be positive and less than 100%; it depends on both the type of hammer/driving cap system and the hammer release device. The energy ratio is reduced, via the factor , to a reference value of 60%, which represents in the first approximation the value of restored energy in American practice:
In case the restored energy is not directly measured with an analyzer, i.e. where the ratio is not a direct entry data into the software, average values of are proposed based on the driving system used for the execution of the tests (Robertson and Wride, 1998). Note that if the energy ratios are provided as well as the driving impact device, Slake prioritizes direct measurement.
3 The total length of the rod string must strictly take into account the above-ground part to the cap of the driving device in addition to the depth of the test:
The length of the above-ground rod string varies (depending on the size of the drill rods). Slake considers by default a metric length above ground: , however, it can be adjusted in advanced options.
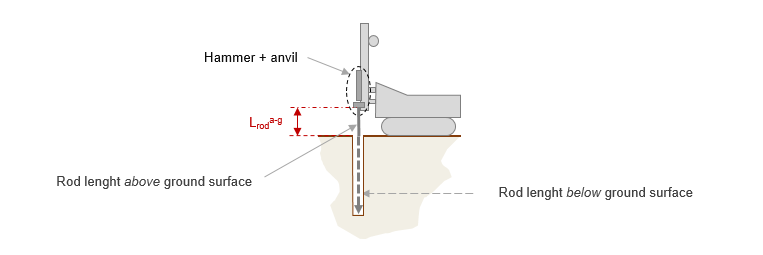
In the unavailability of accurate data on this subject, it is recommended to neglect this overlength of the rod string and consider only the depth of the test (conservative hypothesis). Note that, strictly speaking, the depth of the test should be increased by 15 cm to take into account the priming penetration.
4 The use of truncated cone cores (a variable inner diameter of 35 to 38 mm) or cylindrical cores with split spoons for a liner, but used without a liner, results in a significant decrease in the number of blows (+10/+30%). If one of these sampling methods is used, Slake applies by default a correction of 20% on the number of SPT blows. On the other hand, no correction is applied for a sampling carried out with cylindrical cores without splits (constant inner diameter of 35 mm), or with splits but equipped with liners.
Case of the "NCEER/SGT-LIQ-AFPS" calculation option
When this calculation option is selected, the determination of the correction factors , and is modified as follows:
| Correction factor | Parameter | Type0 | Expression ot the correction |
|---|---|---|---|
| Overburden pressure1 | Automatic | ||
| Rod string lengths2 | Automatic | ||
| Sampling method3 | Manual |
0 For the definition of the "type" of correction, "Automatic" means that it is directly applied by the software, "Manual" means that the correction depends on specific input parameters to be provided by the user.
1 The normalization of the number of SPT blows relative to the stress level is calculated using the formula of Liao and Whitman (1986) for overburden pressures less than 200 kPa, and usig the formula of Kayen et al. (1992) for higer overburden pressures. This correction term is automatically limited to . This correction applies to the states of stress prevailing in the studied soil at the time of the execution of the tests; they are normalized by a reference pressure taken equal to the atmospheric pressure (~100 kPa).
2 The total rod string length is determined as specified by equation (12). The correction factor for the total rod string length is taken from NF EN ISO 22476-3 (AFNOR, 2005).
3 The use of truncated cone cores (a variable inner diameter of 35 to 38 mm) or cylindrical cores with split spoons for a liner, but used without a liner, results in a significant decrease in the number of blows (+10/+30%). If one of these sampling methods is used, a correction of up to +30% on the number of SPT blow count should be applied. By default this value is set to +15%, but can be set manually. On the other hand, no correction is applied for sampling with cylindrical core barrels without reservations (constant internal diameter of 35 mm), or with reservations but equipped with liners.
Step n°2: Correction for fines content to get a "clean-sand" equivalent
The cyclic resistance ratio increases with increased fine content. The normalized number of blows is reduced to a "clean sand" equivalent (CS = clean sand) according to the correlations of Idriss and Seed:
The coefficients and are determined from the detailed relationships in the following table.
| Condition on the fines content FC1 | Coefficient | Coefficient |
|---|---|---|
1Nota: Strictly speaking, the fine content (FC) used to establish these correlations is in accordance with ASTM, and therefore corresponds to the percentage by weight of passing through the 75µm sieve. This sieve is not used in the French standard of granulometric analyses (NF P 94-056), the closest is the 80 µm sieve.
Step n°3: Expression of cyclic resistance ratio
For a "clean sand" equivalent and for an earthquake of 7.5 magnitude, the expression of normalized cyclic resistance ratio extracted from the liquefaction curves of Seed et al (1985), is given by Rauch (1998):
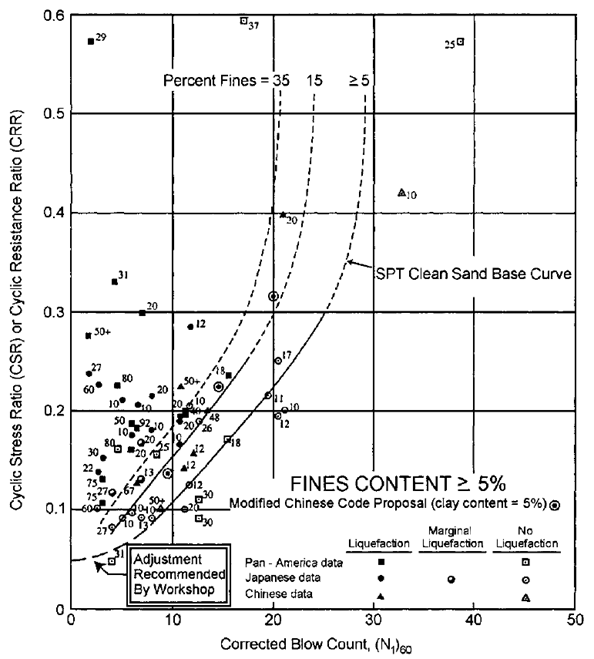
This formulation is valid for a normalized number of blows ; beyond this threshold the materials are considered too dense to liquefy and no factors of safety are calculated.
Assessment based on cone penetration tests (CPT et CPTu)
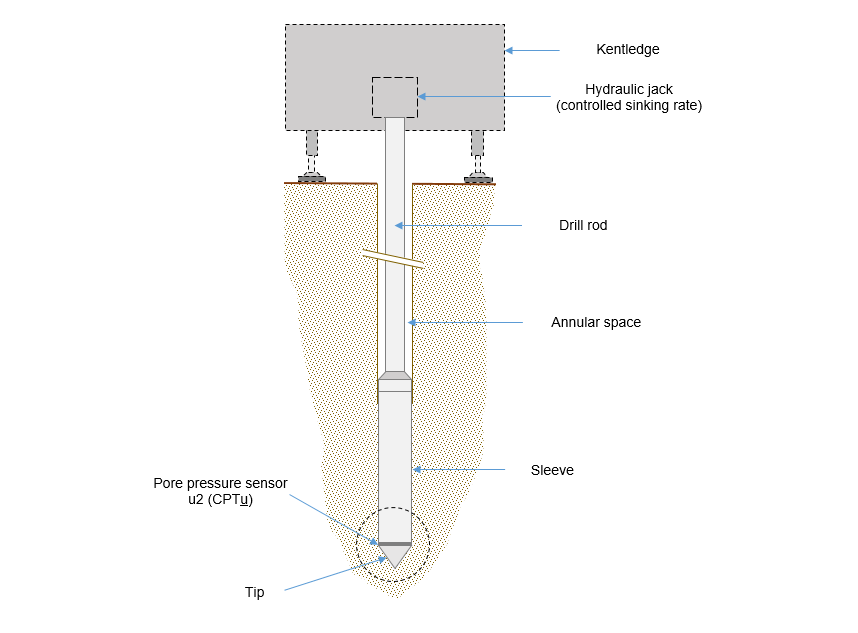
Principle of the CPT(u) test
The cone penetration test is framed by the French standard NF P 94-113. It consists generally of driving a probe into the ground at controlled speed (low and constant), up to a target depth or obtaining the refusal. During the driving, are recorded almost continuously (with a variable measurement step, usually of a centimetre order for electrical tips and decimetre for mechanical tips) the parameters of apparent resistance at the tip and friction around the probe's sleeve, which is widened from the rod string.
The cone penetration test with piezocone (CPTu) differs from the cone penetration test (CPT) by the additional measurement of pore-water pressure. This can be measured in different positions of the probe (, , ). In the context of using tests with piezocone for implementation of the "NCEER" method, it is the measurement of pore-water pressure at the pressure sensor (located just above the shoulder of the cone) that should be recorded.
Input parameters - CPT(u)
The conduct of liquefaction analyses from the CPT or CPT(u) tests requires information on the following parameters from the test minutes.
| Parameter | Definition | Information | Test |
|---|---|---|---|
| Natural ground elevation survey elevation | General | CPT and CPTu | |
| Average piezometric level at the time of testing (preferably measured in a piezometric survey in the immediate vicinity) | General | CPT et CPTu | |
| Test depth | At any point of measurement | CPT et CPTu | |
| Tip resistance (static) | At any point of measurement | CPT et CPTu | |
| Sleeve friction | At any point of measurement | CPT et CPTu | |
| Pore-water pressure measurement at the level of pressure sensor u2 behind the cone | At any point of measurement | CPTu | |
| 1 | Correction factor on the tip resistance due to the pore-water pressure | General | CPTu |
| Corrected tip resistance | At any point of measurement | CPTu |
1 A correction on the measured tip resistance is made necessary as the and the pressure at the back of the cone apply to different sections. This correction is all the more important when the pore-water pressure is high, for example in soft clays (Reiffsteck, Lossy and Benedict).
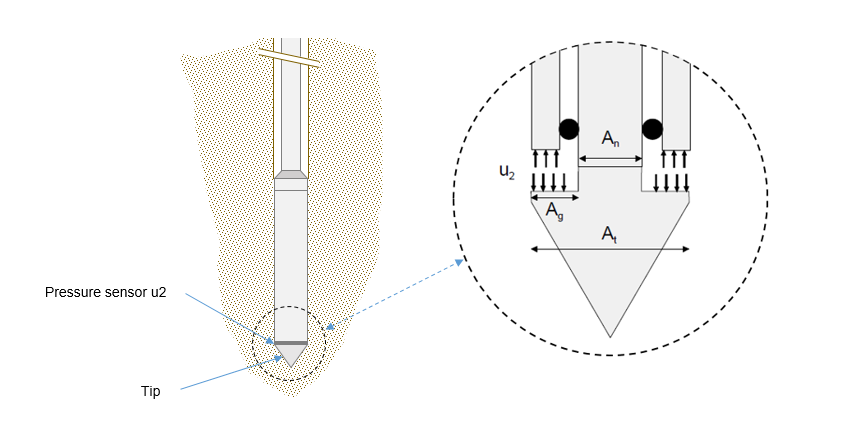
The parameter is expressed as the ratio of the sections of the probe identified in the previous figure:
Providing this parameter leads to the automatic correction of the static tip resistance regarding the pore-water pressure (the correction on lateral friction measurements is negligible):
In practice, the parameter that depends on the particularities of the used probes is data that must be provided by the sounder and included on the test minutes. Its value is generally between 0.5 and 0.9 and should not be less than 0.5.
Formulation of based on CPT(u) tests
The cyclic resistance ratio term is calculated sequentially. The procedure is schematized in the logigram below.
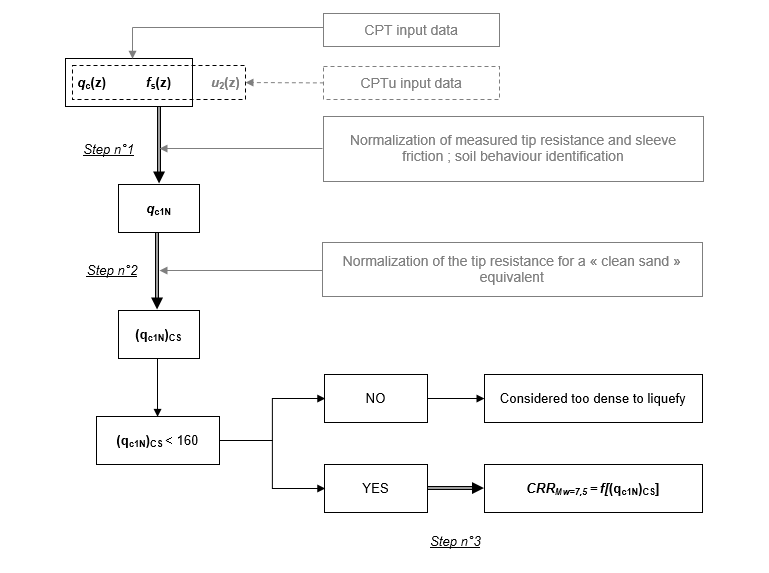
Step n°1: Normalization of Cone Penetration parameters CPT(u)
The criterion for evaluating the cyclic resistance ratio through analysis based on the use of cone penetration test implies the normalization of the tip resistance term:
This normalization involves a reference pressure (, equal to atmospheric pressure) and an exponent on the stress ratio, , which depends on the nature of the soil tested and varies between 0.5 (granular soils) and 1.0 (cohesive soils). The normalization procedure is detailed in the following figure.
For CPT(u) tests, without the possibility of sampling, the qualification of the examined soils is based on the introduction of the "soil behaviour type index" term (Robertson and Wride, 1998):
This expression depends on the normalized parameters of tip resistance and friction ratio :
In the case of testing with piezocone (CPTu), the static tip resistance considered in the equations (16), (18) and (19) is the corrected term for pore-water pressures (14) instead of .
The bi-logarithmic scale diagram allows, thanks to the computation of a large database, to estimate the nature and state of the tested soils. Robertson's classification of soils from the analysis of normalized parameters of in situ measurements is recalled in the following figure.

| Zone | Identification |
|---|---|
| 1 | Sensitive, fine grained |
| 2 | Organic soils - peats |
| 3 | Clays - silty clay to clay |
| 4 | Silt mixtures: clayey silt to silty clay |
| 5 | Sand mixtures: silty sand to sandy silt |
| 6 | Sands - clean sand to silty sand |
| 7 | Gravelly sand to dense sand |
| 8 | Very stiff sand to clayey sand (heavily overconsolidated to cemented) |
| 9 | Very stiff, fine grained (heavily overconsolidated to cemented) |
Step n°2: Correction for fines content to get a "clean sand" equivalent
The cyclic resistance ratio increases with increased fine content. Normalized tip resistance is reduced to a "clean sand" equivalent (CS = clean sand), according to Robertson and Wride correlations:
The correction factor is determined, as a function of the soil behaviour type index , according to the criteria presented in the following table.
| Condition | Factor |
|---|---|
Step n°3: Expression of cyclic resistance ratio
For a "clean sand" equivalent and for an earthquake magnitude of 7.5, the expression of the cyclic resistance ratio characterizing the empirical liquefaction curve of a clean sand is given below (Robertson and Wride.1998):
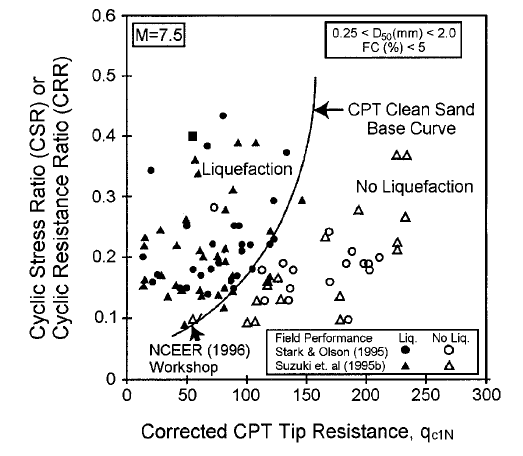
This formulation is valid for a normalized tip resistance less than 160; beyond this threshold the materials are considered too dense to liquefy and no factors of safety are calculated.
Additional notes on the soil behaviour type index
Because of the approximate nature of the relationship between the soil behaviour type index , and the actual nature of the soils tested, the user is cautioned about:
- Soils with values above 2.4 should be sampled and laboratory-tested to confirm their nature (especially their fine content defined as the 80 µm sieve passing and their plasticity index).
- The "NCEER" method introduces a threshold value of the soil behaviour type index beyond which the tested material is deemed too clay-rich or too plastic to liquefy. This default value is set at , but can be changed in Slake by the user in advanced options (not recommended).
- Soils with a soil behaviour type index greater than 2.6 but associated with a normalized friction ratio less than 1% should be sampled and tested in the laboratory. The latter are described by the authors of the "NCEER" procedure as very sensitive to cyclic softening (a phenomenon not quantified by the "NCEER" procedure).
- For materials with low to very low corrected tip resistances (less than 3 MPa), the interpretation of the soil behaviour type index may become questionable.
Evaluation of earthquake-induced settlements
Principles of calculation
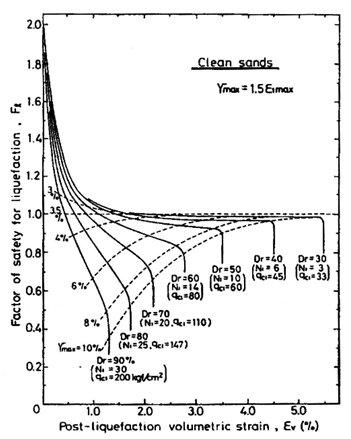
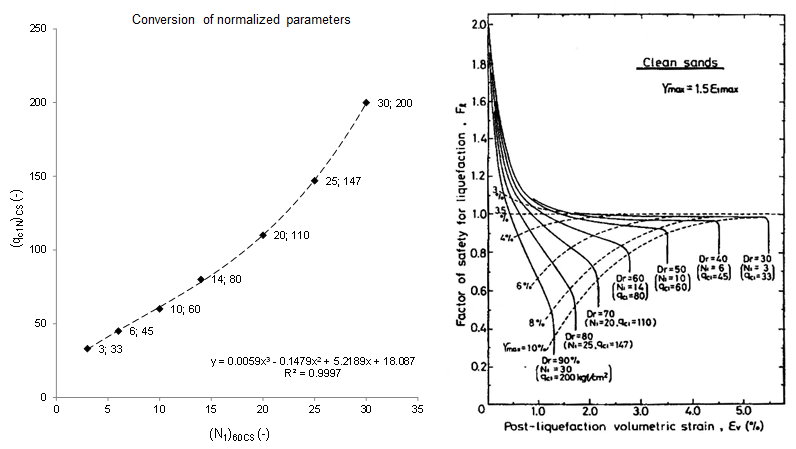
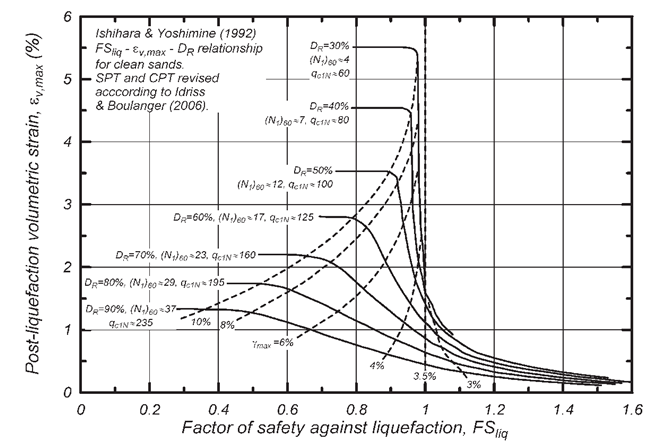
The methods implemented in Slake are derived from the Ishihara and Yoshimine (1992) curves originally linking the volumetric strain resulting from the dissipation of excess pore-water pressures in shear tests correlated with the factor of safety regarding the liquefaction hazard and the relative density of clean sands, the latter itself being correlated to the normalized and parameters. These curves have been validated by measurements of post-liquefaction settlements performed in situ, at different sites with a generally flat and sub-horizontal topography, by using the hypothesis of volumetric strains () roughly equal to principal axial strains () (one-dimensional calculation with zero lateral strain). Post-liquefaction volumetric strain rates are then linked to normalized resistance parameters for a given level of safety:
With in the case of CPT(u) tests, and in the case of SPT tests.
Settlements are then determined by summing local settlement increments on all measurement points:
By default, the integration step of volumetric strains around a measurement point is given by the interval between the two measures surrounding the test point (geometric increment). However, this height can be arbitrarily bounded by a maximum integration step :
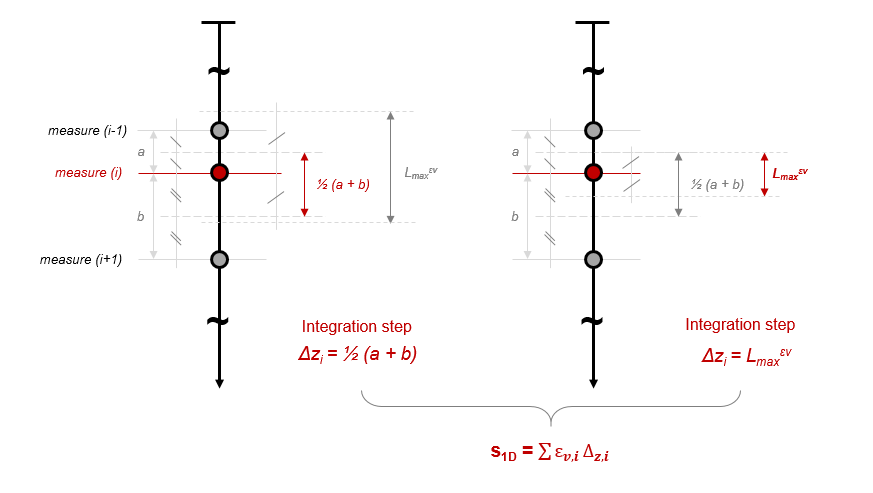
The introduction of this limit is particularly useful in the case of SPT analyses, where discrete measurements between consecutive tests can be very spaced without an actually liquefiable layer being locally intercepted, having however a vertical extension equal to this geometric increment. The maximum integration step limit is by default set at 1.00 m but can be modified by the user in advanced options.
Important notes: the hypothesis of construction of post-liquefaction settlements under water-table by continuous integration of volumetric strains calculated at each measurement point of the examined soil column implicitly assumes that the settlement in depth generated by a liquefied level is fully reflected on the surface, regardless of the stratification conditions of the site and of the development of arch effects in the case of liquefied soil lenses. The volumetric strains estimated by this method are considered only by considering a fine grained matrix, without taking into account the possible presence of coarse elements of more or less large diameter (incompressible) and whose rearrangement would limit necessarily settlement on the surface.
In addition, in the case of an unconfined water-table, a sandy material located less than one meter below the water-table surface will not liquefy because it will be drained, and the post-liquefaction settlements calculated there will be overestimated. The attention is therefore focused on the fact that the settlements estimated by this method systematically correspond to a higher bound. On the other hand, estimated settlements between different survey points cannot be directly interpreted in terms of differential settlements.
Estimation of volumetric strains
Zhang, Robertson and Brachman (2002) Correlations
From CPT(u) tests
For a previously calculated factor of safety , the empirical relationship between post-liquefaction volumetric strain and normalized tip resistance for a clean-sand equivalent is given by equations shown hereafter (Zhang, Robertson and Brachman.2002), based on the curves of Ishihara and Yoshimine (1992).
| Condition on | Condition on | Volumetric strain |
|---|---|---|
| - |
Note: When the calculated value of exceeds 200, the associated volumetric strain is automatically equal to zero (). Also, the calculated values of less than 33 are reduced to , the maximum strain rate indicated by the Ishihara and Yoshimine curves - regardless of the level of safety associated with a measurement point - being limited to 5.5%.
From SPT tests
With respect to the use of SPT surveys, the evaluation of post-liquefaction volumetric strains is determined in a rigorously identical manner to that presented for the CPT (u) tests. The equations of Zhang, Robertson and Brachman (2002) are repeated by transposing the normalized parameters from SPT analyses into normalized parameters derived from CPT(u) analyses by the following polynomial approximation, based on abacus of Ishihara and Yoshimine (1992):
Idriss and Boulanger (2008) Correlations
From CPT(u) tests
For a factor of safety preivously calculated, Yoshimine (2006) proposed the following equation for the empirical relation between the volumetric post-liquefaction deformation and the normalized SPT blow count for a clean sand equivalent derived from the Ishihara & Yoshimine (1992) charts :
In this equation, the volumetric deformation , the relative density and the maximum distorsion are expressed as a percentage.
The contribution of Idriss & Boulanger (2008) lays in the corelation between the relative density (expressed in decimals) SPT blow count for a clean sand equivalent :
The calculation of the volumetric deformation is linked to the maximum distorsion , expressed as a percentage :
This expression introduces which also depends on the relative density :
Note : Ishihara & Yoshimine (1992) curves ploted for relative densities less than 40% aswell as those pltoed with a mawimum distorsion less than 3% were established with few data and may lack reliability.
From SPT tests
For a factor of safety preivously calculated, Yoshimine (2006) proposed the following equation for the empirical relation between the volumetric post-liquefaction deformation and the normalized CPT tip resistance for a clean sand equivalent derived from the Ishihara & Yoshimine (1992) charts :
In this equation, the volumetric deformation , the relative density and the maximum distorsion are expressed as a percentage.
The contribution of Idriss & Boulanger (2008) lays in the corelation between the relative density (expressed in decimals) and the normalized CPT tip resistance for a clean sand equivalent :
Note : in the equation (28) the multiplier term 0,975 was introduced to adjust the relation to ensure a better fit of the results with the abacus from Ishihara & Yoshimine (1992).

The calculation of the volumetric deformation is linked to the maximum distorsion , expressed as a percentage :
This expression introduces which also depends on the relative density :
Note : Ishihara & Yoshimine (1992) curves ploted for relative densities less than 40% aswell as those pltoed with a mawimum distorsion less than 3% were established with few data and may lack reliability.
Additional indicators
Cumulative liquefiable thicknesses
The cumulative height of liquefiable soils is the sum, on a vertical of the elementary slices, on both sides of a measurement point associated with a threshold value of the safety factor. This is an overall indicator of the thickness with risk of an examined soil column. In Slake, it is possible to express this indicator with respect to the limit factor of safety (stability) and to the target factor of safety for a certain required level of safety.
The cumulative height of liquefiable soils regarding the limit safety factor is expressed as:
With
as defined by the equation (25)
And
The cumulative height of liquefiable soils regarding the target safety factor is expressed as:
With
as defined by the equation (25)
And
Liquefaction Potential Index LPI
Iwasaki et al. (1978) propose to extend the concept of a local factor of safety regarding liquefaction hazard, calculated discreetly at each point of a survey, to a global parameter characterizing the entire soil column investigated by the survey (SPT or CPT(u)) via the introduction of a liquefaction index ("Liquefaction Potential Index", LPI).
This one is determined by the integration of severity indexes F(z) (to be distinguished from factors of safety FS(z)) along 20 m - depth beyond which the risk is considered negligible by the authors - by associating them with a weighting function w(z) managing the decrease in the relative importance of FS in depth.
With
And
In practice, the implementation of this index in Slake follows the expression below:
Where and functions are defined in accordance with equations (38), (39) and (40), and the integration step is identical to that defined in equation (25).
Sonmez (2003) proposes the following characterization of hazard regarding the LPI index :
Low risk
Moderate risk
High risk
Very high risk
This approach proposes an "overall" diagnosis to the right place of a survey test point by smoothing the discrete analysis that is done in each measurement point.
References
[1] Youd T.L. and Idriss I.M. (2001). Liquefaction resistance of soils: summary report from the 1996 NCEER and 1998 NCEER/NSF workshops on evaluation of liquefaction resistance of soils, JGGE, ASCE. 127, vol. 10, 817-833
[2] Ishihara K. and Yoshimine M. (1992). Evaluation of settlements in sand deposits following liquefaction during earthquakes, Soils and Foundations Vol. 32, N°1, 173-188, Mar. 1992 / JSCE
[3] Zhang G. Robertson P.K. and Brachman R.W.I. (2002). Estimating liquefaction-induced ground settlements from CPT for level ground, CGJ, vol. 39, 1168-1180
[4] Idriss I. M. and Boulanger R. W. (2008). Soil liquefaction during earthquakes, Earthquake Engineering Research Institute, 237p
[5] Yoshimine M., Nishizaki H., Amano K. and Hosono Y. – Flow deformation of liquefied sand under constant shear load and its application to analysis of flow side of infinite slope. Soil Dynamics and Earthquake Engineering, 26:253-264 (2006)
[6] Scordilis E.M. (2006). Empirical global relations converting Ms and mb to moment magnitude, Journal of Seismology (2006) 10: 225-236
[7] Iwasaki T., Tokida K. and Tatsuoka F. (1981). Soil Liquefaction Potential Evaluation with Use of the Simplified Procedure, First International Conference on Recent Advances in Geotechnical Earthquake Engineering and Soil Dynamics
[8] Robertson P.K. and Cabal K.L. (Gregg Drilling & Testing, Inc.) (2015). Guide to Cone Penetration Testing for Geotechnical Engineering, 6th Edition
[9] Skempton A. W. (1986) Standard Penetration Test Procedure and the Effects in Sands of Overburden Pressure, Relative Density, Particle Size, Ageing and Overconsolidation. Geotechnique, 36, 3, 425-447
[10] Baldi G., Bellotti V. N., Ghionna N., Jamiolkowski M. and Pasqualini E. (1986) Interpretation of CPT's and CPTU's - 2nd Part : Drained Penetration of Sands. 4th Internation Geotechnical Seminar Field Instrumentation and In-Situ Measurements, Nanyang Technological Institute, Singapore, 25-27 November, 143-156
[11] Cahier Technique : Évaluation du risque de liquéfaction des sols sous l’effet des séismes – Connaissances pratiques et applications aux projets géotechniques. CT45 - Décembre 2020, AFPS
![]()